
 Has gender parity improved since Not Even report?
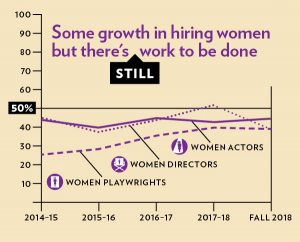
There has been some improvement between 2015 and 2018 for both playwrights and non-union actors, but no growth pattern over that time for union actors or directors.
Women playwrights have seen the biggest gains since the 14-15 season, moving from 25% to 39% over this time period. Non-union women have moved to over half of non-union actors working across these four and a half seasons but union women have a less discernible pattern over this time. Women directors have varied from a low of 38% in the 15-16 season to a high of 52% in 17-18.
The variability of these numbers suggests that even though gender parity might be measured for a single season, additional energy and attention is required to maintain equal representation over time.
| 2014-15* 165 shows |
2015-16 150 shows |
2016-17 153 shows |
2017-18 144 shows |
Fall 2018** 55 shows |
|
| Women Playwrights | 25% 56 artists |
29% 68 artists |
35% 75 artists |
38% 84 artists |
39% 36 artists |
| Men Playwrights | 75% 169 artists |
70% 164 artists |
65% 139 artists |
61% 136 artists |
61% 57 artists |
| Trans Playwrights | 0 % 0 artists |
<1% 1 artist |
0% 0 artists |
<1% 3 artists |
0% 0 artists |
| Women Directors | 45% 92 artists |
38% 77 artists |
43% 84 artists |
52% 108 artists |
39% 27 artists |
| Men Directors | 55% 113 artists |
62% 124 artists |
57% 110 artists |
47% 97 artists |
61% 43 artists |
| Trans Directors | 0 % 0 artists |
0 % 0 artists |
0 % 0 artists |
<1% 1 artist |
0 % 0 artists |
| Women Union Actors | 44% 214 artists |
40% 156 artists |
45% 195 artists |
43% 179 artists |
44% 75 artists |
| Men Union Actors | 56% 270 artists |
60% 233 artists |
56% 238 artists |
57% 236 artists |
56% 96 artists |
| Trans Union Actors | 0 % 0 artists |
0 % 0 artists |
0 % 0 artists |
0 % 0 artists |
0 % 0 artists |
| Women Non-Union Actors | 47% 429 artists |
48% 401 artists |
49% 355 artists |
51% 393 artists |
52% 215 artists |
| Men Non-Union Actors | 53% 477 artists |
51% 425 artists |
50% 358 artists |
48% 367 artists |
46% 189 artists |
| Trans Non-Union Actors | <1% 1 artist |
<1% 2 artists |
1% 6 artists |
1% 7 artists |
2% 10 artists |
Table 2: Some areas of women’s employment has improved
*Shows from July 2014 to Nov 2014 were added to this column to give a full season
**Because data collection ended in December 2018, only the first half of the season is included
How does this data compare to the Not Even data?
In Not Even, our key finding was that women’s employment did not improve over the three and a half theater seasons studied, and actually was lower in the final season than it had been in the first. Comparing the earlier data to the current set reinforces the upward trend for women playwrights and the smaller upward trend for non-union women actors. While the union women have trended upwards as well, they have seen very little change over the last three seasons. Women directors has fluctuated the most, and it is hard to see any trend in this group, which currently has a lower level of representation than it did in the 11-12 season, even thought it was above 50% in the 17-18 season.
The absence of a director trend across all of the data makes a very strong case for framing of gender parity as a concept that requires continued advocacy, rather than a mark to be achieved.