
 How does gender of playwright influence gender of characters in plays?
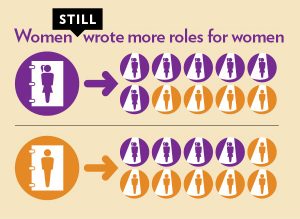
Women and men playwrights wrote with roughly a 55/45 split favoring their gender. In the Not Even Study, playwrights had written with a 60/40 split favoring their own gender, so this is a slight improvement.
Both male and female playwrights seem to be moving towards writing more gender balanced scripts, but it is still clear that producing more female playwrights would lead to greater opportunities for female actors.
Women wrote roles for 588 women actors and men wrote roles for 1460 women actors. However, although men wrote more total roles for women, there are a few other factors at play.
- Total number of plays with male writers is more than two times the total number of plays with female writers.
- Plays by men have a larger average cast size than plays by women.
Average cast size for male playwrights is roughly nine actors and for female playwrights the average cast size is just under six actors. This can partly be explained by looking at the fact that male playwrights are better represented as writers of classic plays, which tend to have larger casts than contemporary plays.
The budget related data (see table 3) shows that men playwrights get over two thirds of the productions at the highest budget level. This, plus the smaller cast size for women writers suggest that women playwrights are still working on a smaller scale and with fewer resources than their male counterparts.
| Shows written by Women or All Woman Teams 199 playwrights●178 shows 35% Non-Union/Union Code 65% Union Contract |
|||
| Women | Men | Trans | |
| Directors | 63% 122 artists |
37% 72 artists |
0% 0 artists |
| Union Actors | 53% 243 artists |
47% 217 artists |
0% 0 artists |
| Non Union Actors | 59% 345 artists |
40% 234 artists |
1% 7 artists |
Table 8: Shows written by Women
| Shows written by Men or All Men Teams 486 playwrights●366 shows 39% Non-Union/Union Code 61% Union Contract |
|||
| Women | Men | Trans | |
| Directors | 38% 174 artists |
62% 282 artists |
0% 0 artists |
| Union Actors | 39% 435 artists |
61% 677 artists |
0% 0 artists |
| Non Union Actors | 47% 1025 artists |
52% 1137 artists |
<1% 11 artists |
Table 9: Shows written by Men