
 What’s the overall picture? How much work is there for women, men and non-binary artists in the San Francisco Bay Area?
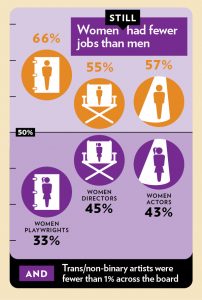
In the 605 shows counted, men outnumbered women in every category except non-union actor. Non-binary artists made up no more than 1% of artists in any category.
Women outnumbered men as non-union actors, but made up less than 50% in all other categories, with playwriting the lowest at 33%. Trans artists were 1% of the non-union actors, but less than 1% in every other category, except union actors, which had no trans artists.
Not every show had one playwright and one director. Some plays were co-written and/or co-directed. Some shows were an evening of short plays that had more than one playwright and/or more than one director. For musicals, the musical director is counted in the director category, and all writers (book, lyrics, composer) are counted in the playwright category.
| Women | Men | Trans & Non-Binary | |
| Playwright | 33%
302 artists |
66%
606 artists |
<1%
4 artists |
| Director | 45%
359 artists |
55%
443 artists |
<1%
1 artist |
| Union Actor | 43%
740 artists |
57%
970 artists |
0%
0 artists |
| Non Union Actor | 50%
1622 artists |
49%
1593 artists |
1%
25 artists |
Table 1: Women mostly had fewer jobs than men
How does this data compare to the Not Even data?
Though not at parity, women artists are gaining ground in all areas.
In 2015’s Not Even women non-union actors were the closest to parity at 46% and playwrights trailed furthest behind at 27%. With this data set, all groups have made gains in representation, with the largest change happening for playwrights. However, the only group that shows parity at this time is non-union actors.