
 QUESTION:
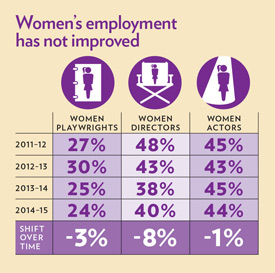
Have the employment numbers for women changed over time?
FINDING:
Between 2011-2014, there was no significant improvement in women’s employment in San Francisco/Bay Area theatre.
During this time, women union actors made very slight gains, moving up six points, from 38% to 44% and women non-union actors wobbled their way down four points from 48% to 44%. The proportions for women directors dropped and then rebounded slightly, traveling from 48% down to 38% then up to 40% for a net loss of eight points. The women playwrights numbers have dropped as well, accounting for only one quarter of the shows produced in the last eighteen months of the study.
Gender parity requires continued attention and energy on many fronts in order for us to reach equal representation for playwrights, directors and both union and non-union actors.
TABLE 2 – Women’s Employment Has Not Improved
| 2011-2012 123 Shows |
2012-2013 145 Shows |
2013-2014 150 Shows |
2014-2015* 82 Shows |
|
| Women Playwrights |
27% 42 artists |
30% 57 artists |
25% 54 artists |
24% |
| Men Playwrights |
73% 111 artists |
70% 131 artists |
75% 160 artists |
76% 83 artists |
| Women Directors |
48% 68 artists |
43% 71 artists |
38% 68 artists |
40% 39 artists |
| Men Directors |
52% 73 artists |
57% 95 artists |
62% 113 artists |
60% 58 artists |
| Women Union Actors |
38% 119 artists |
39% 180 artists |
40% 173 artists |
44% |
| Men Union Actors |
62% 195 artists |
61% 278 artists |
60% 255 artists |
56% 132 artists |
| Women Non-Union Actors |
48% 284 artists |
45% 310 artists |
47% 333 artists |
44% 220 artists |
| Men Non-Union Actors |
52% 305 artists |
55% 379 artists |
53% 374 artists |
56% 280 artists |
*Note: Because data set was capped at 500 shows, only about half of the 2014-2015 season is included